New on AxaMonitor today:
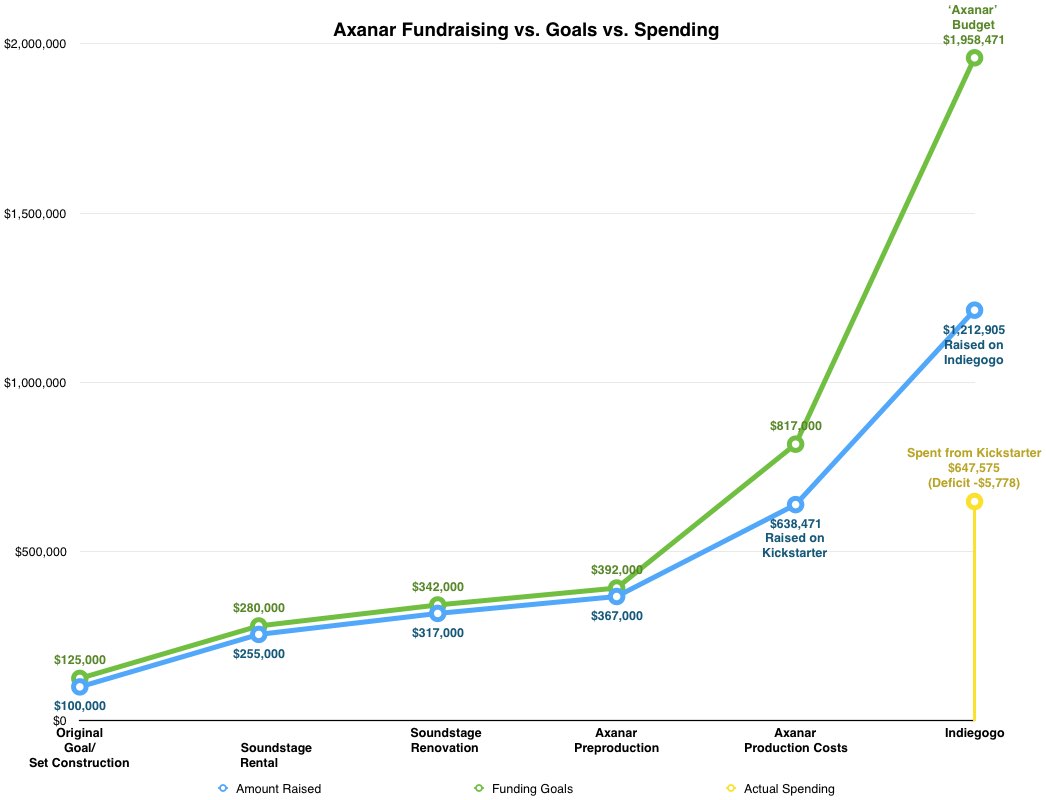
AMBITION VS. ACHIEVEMENT As demonstrated in this new analysis of Axanar's finances, at each significant stage in its fundraising history, its ambition appears to have outstripped its fundraising capabilities, and its spending has always outpaced what it has publicly reported about its income.
Read more »
this diagram leaves me unclear in a couple ways
1. didnt axanar say they intended to run several fundraisers to pay for the full 4 parts? is the right side comparing the 'budget' for 4 parts with the fundraising for, example the first part? Its not clear to me. if the top of the green line is the budget just for what they have already stated the indiegogo is supposed to cover (the 'first part' of the movie (?)), then thats fine, but I think it should say so. if not, it should perhaps be adjusted so that the budget tracks the intention of the latter fundraising phases.
2. the intro says their spending has 'always significantly outpaced their fundraising', but the first half of the graph shows budget (a surrogate for spending perhaps?) tracking quite closely. also, the only spending indicator is the one line on the right. it doesnt really allow me to draw much of a conclusion... in fact it looks considerably less than the blue 'fundraising' line, and than the budget too.
I might have expected spending to be shown across the graph. that way, if spending exceeded fundraising, or the budget, I would see it.
one very interresting thing you could put in along with the spending, is another line showing running total cash allocated to the disputed studio infrastructure and salaries (to the extent you can break out crew from non-crew that might help).
3. the graph upon reflection seems to be showing the numbers separately for each phase of additional goals/spending/fundraising, but the trend line suggests its somehow accumulative. a side by side bar might emphasize that each phase is its own set of numbers.
I guess it really depends what you want to show. the running grand totals
since project start up to and including each phase, especially if you could show a bunch eaten out of the base for 'long term assets' and 'salaries', would show something interesting -- where has the money gone in net total and what was done with the funds raised each time.
you would need to show at each datapoint, budgeted as of completion date of phase, funds raised towards completion of phase, and spent as of completion of the phase. For phases not complete you would need to somehow show projected numbers and actuals to date. either running totals, or separate clusters of numbers contained within each phase.
just giving a reaction as a reader of graphs..