^I don't think that's quite it either. That's more or less a regular looking sine wave.
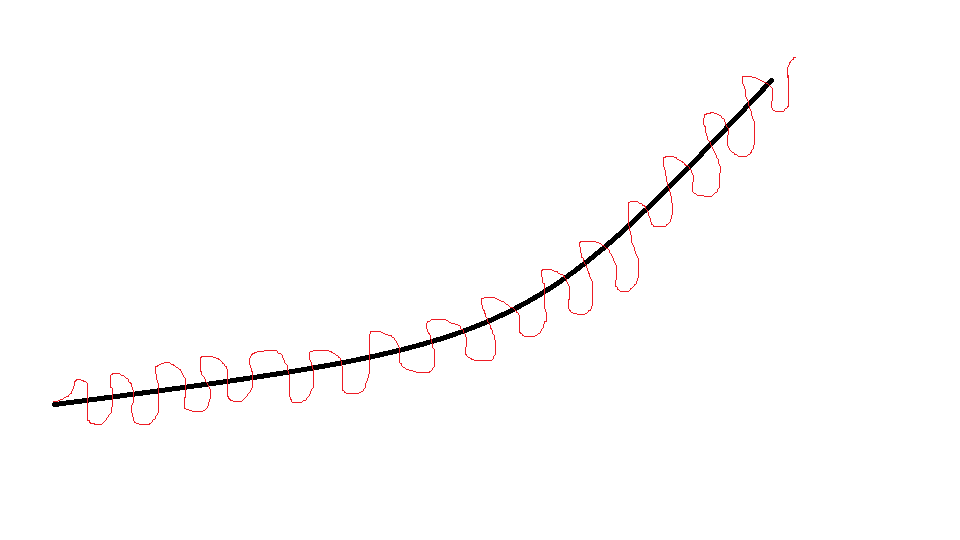
Anyway if I'm understanding the question. I agree about the basic idea, that is exponential (say x^2) plus sine wave (sin (x)). That doesn't lead to much of a nice looking line though. Just messing around with the values on a graph, (x/5)^1.5+sin(2x) looks decent enough to me.
It shouldn't be hard to get points from there. Sine has a period of 2pi, and since i'm using 2x inside of sin, that means the period is effectively just pi. So to get it to cycle every 8 data points, make x = 0, 1*pi/8, 2*pi/8... anyway solving all those to get the data points is an easy job for a spreadsheet so I come up with:
Code:
0	0
0.3926990817	0.7291175302
0.7853981634	1.0622557996
1.1780972451	0.8214779881
1.5707963268	0.1760859923
1.9634954085	-0.4610191258
2.3561944902	-0.676509376
2.7488935719	-0.2994620043
3.1415926536	0.4980463969
3.5342917353	1.3013970052
3.926990817	1.6960409996
4.3196898987	1.5101221362
4.7123889804	0.9149696554
5.1050880621	0.3245847142
5.4977871438	0.1529935441
5.8904862255	0.5716021856
6.2831853072	1.4086879383
6.6758843889	2.2499017152
7.0685834706	2.6809065895
7.4612825523	2.5300167649
7.853981634	1.9687012432
8.2466807157	1.4110776136
8.6393797974	1.2712704116
9.0320788791	1.7207696326
9.4247779608	2.5879249918
9.8174770425	3.4584504107
10.2101761242	3.9180642099
10.6028752059	3.7951293683
10.9955742876	3.2611582147
11.3882733693	2.7303070404
11.780972451	2.6167351264
12.1736715327	3.0919638054
12.5663706144	3.984371175
12.9590696961	4.8796969634
13.3517687778	5.3636830392
13.7444678595	5.2647139396
14.1371669412	4.7543217918
14.5298660229	4.2466811203
14.9225651046	4.1559680438
15.3152641863	4.6537194821
15.7079632679	5.5683279968
16.1006623496	6.4855467673
16.4933614313	6.9911301974
16.886060513	6.9134745293
17.2787595947	6.4241228398
17.6714586764	5.9372599147
18.0641577581	5.8670715044
18.4568568398	6.3851035845
18.8495559215	7.3197572435
19.2422550032	8.2567937006
19.6349540849	8.7819749512
20.0276531666	8.7237044151
20.4203522483	8.2535319631
20.81305133	7.7856488204
21.2057504117	7.7342468472
21.5984494934	8.2708778224
21.9911485751	9.2239483526
22.3838476568	10.1792249093
22.7765467385	10.7224744918
23.1692458202	10.6821052918
23.5619449019	10.2296717345
23.9546439836	9.7793693959
24.3473430653	9.7453942958
24.740042147	10.2993021934
25.1327412287	11.2695035065
25.5254403104	12.2417683587
25.9181393921	12.8018672519
26.3108384738	12.7782117386
26.7035375555	12.3423594718
27.0962366372	11.9085091285
27.4889357189	11.8908597108
27.8816348006	12.4609698467