I don’t know about simian pecking orders, so I can't comment on any similarities.
The algorithm used here is known variously as the Schulze Method, the Beatpath method, and Cloneproof Schwarz Sequential Dropping. Beatpath and CSSD are actually two different algorithms that provably produce the same results; both are known as the Schulze Method after Marcus Schulze, whose analysis of the behavior of the methods helped to popularize them.
You can Google for the details, but I'll describe the basic idea.
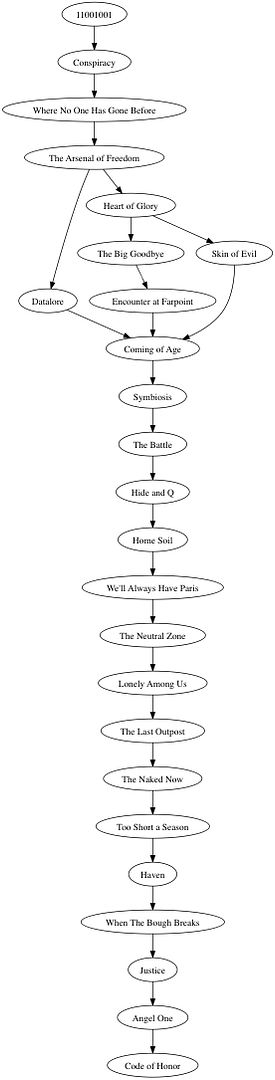
Given the preferences you posted I can determine, for any given pair of episodes, whether you have expressed a preference between the two episodes and if so which. (You, for example, expressed a preference of Hide and Q over Conspiracy, but no preference between Hide and Q and Encounter at Farpoint.) Thus, for any pair of episodes, we can take a vote to see which episode is preferred by the majority of those who express a preference.
The graph above indicates that Conspiracy wins against Where No One Has Gone Before, but the vote between Conspiracy and 11001001 is a tie, as is the vote between WNOHGB and 11001001. (Note that the somewhat complex shape of this graph is a result of the small number of voters we have, which allows for a lot of ties. Ties are much less common when there is a very large number of voters, unless they’re Floridians.)
It is possible for the method I just described to produce a graph with cycles. The Schulze Method has provisions for breaking any such cycles to produce a DAG. You can Google for the details, or we can discuss them later.
The algorithm used here is known variously as the Schulze Method, the Beatpath method, and Cloneproof Schwarz Sequential Dropping. Beatpath and CSSD are actually two different algorithms that provably produce the same results; both are known as the Schulze Method after Marcus Schulze, whose analysis of the behavior of the methods helped to popularize them.
You can Google for the details, but I'll describe the basic idea.
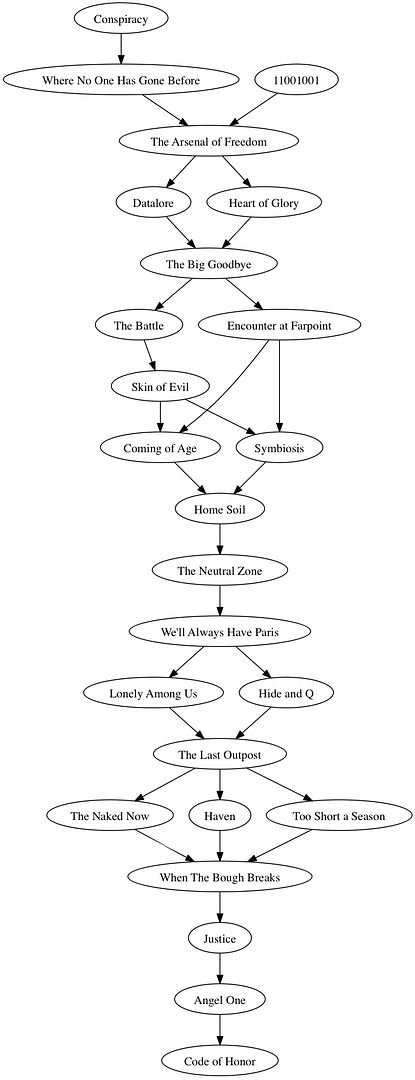
Given the preferences you posted I can determine, for any given pair of episodes, whether you have expressed a preference between the two episodes and if so which. (You, for example, expressed a preference of Hide and Q over Conspiracy, but no preference between Hide and Q and Encounter at Farpoint.) Thus, for any pair of episodes, we can take a vote to see which episode is preferred by the majority of those who express a preference.
The graph above indicates that Conspiracy wins against Where No One Has Gone Before, but the vote between Conspiracy and 11001001 is a tie, as is the vote between WNOHGB and 11001001. (Note that the somewhat complex shape of this graph is a result of the small number of voters we have, which allows for a lot of ties. Ties are much less common when there is a very large number of voters, unless they’re Floridians.)
It is possible for the method I just described to produce a graph with cycles. The Schulze Method has provisions for breaking any such cycles to produce a DAG. You can Google for the details, or we can discuss them later.

")